Simulation Display
Once the FE Model and Boundary Conditions are defined, we can run the Static Analysis or any other simulation you choose to run. If you are running a static analysis, make sure you have at least a displacement restraint in the boundary conditions, otherwise you will have an error.

Once you run an analysis, a heads up display (HUD) will appear showing the results. The HUD allows you to explore several different types of results, edit the upper and lower bounds of each, and probe results at individual mesh elements.
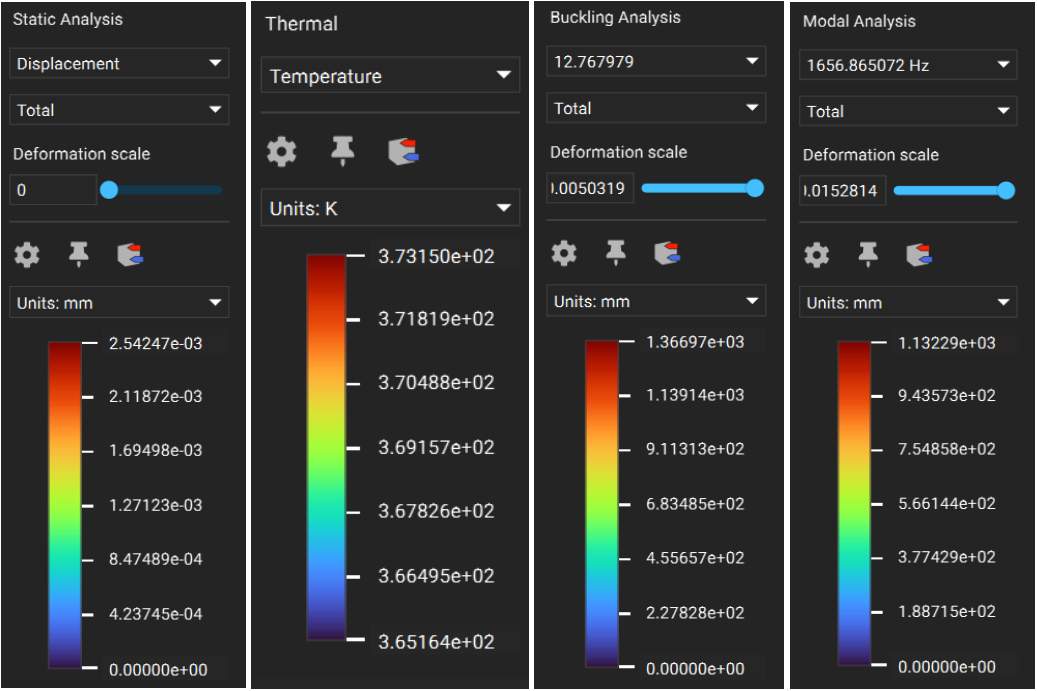
HUD Examples for Static Analysis, Thermal Analysis, Modal Analysis, and Buckling Analysis
Below are examples of the different displays for the static analysis, and we will go into further detail into these and the display options for the modal and buckling analysis in the follow-along lessons at the end of this section.
The Displacement results show you how much your model moves under the given boundary conditions. View a scaled version of the displacement by sliding the Deformation scale up. You can view either the Total or Directional displacement by changing the second combo box from the top of the HUD.

With the Strain option, you can view the Principal Strain for Min, Mid, and Max, or the Strain of Components.
With Stress, you can view the Von Mises Stress, the Principle Stress, or the Components Stress. For each option, you can choose to view the Min, Mid, or Max.

With Reaction Forces, you can see the Total or Directional forces within the model.

Use the Probe Values tool to display the numerical values of element vertices. The Probe Values tool enables probing section cuts for volume simulation results by checking the “Show volume mesh elements” in the Section Cut dialog box. Note that the numerical value displayed correlates with the vertex of the full element at the section cut, which may not be directly on the section cut plane.

Toggle the Min/Max to flag to quickly identify the location of minimum and maximum values in your simulation results. The location of the minimum value will be automatically identified with a blue tag, while the maximum value will be identified with a red tag.

Open the HUD Settings to choose between banded or continuous colors for contour plots. You can select the number of bands for the new banded option in the legend, allowing you to easily visualize stress and strain thresholds.
